Last week Microsoft released a new editor "Visual Studio Code", a cross-platform editor (Windows, Linix, and Mac OSX), to develop ASP.NET 5 and Node.js applications.
Being a big sucker for any new development tool, naturally I downloaded and installed it on my Mac.
If you haven't done this yet, go to Visual Studio Code site and follow the instructions to setup your environment and then come back here.
Ready? Great. Lets get started...
Create a console application
- Create a folder “VSCodeProjects” on your desktop and open terminal in that folder.
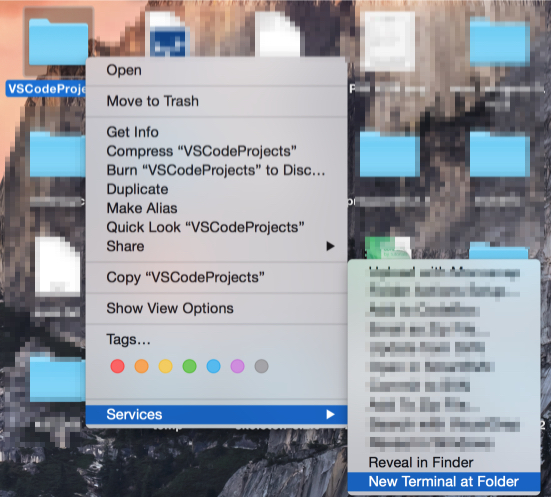
- Enter the following command in the terminal and follow the prompts to create a new console application. Take defaults for everything.
yo aspnet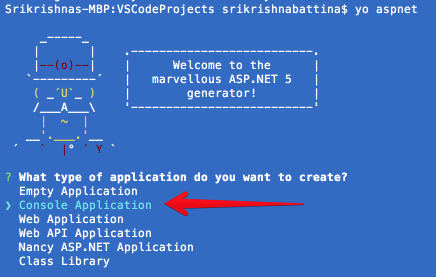
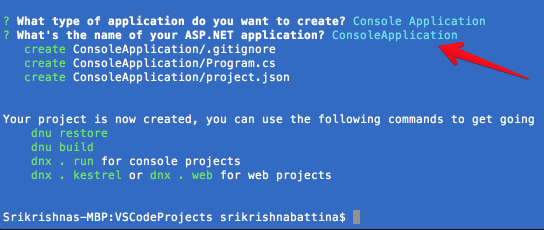
- Now our app is created, lets build and run it. First change directory to our app folder
cd ConsoleApplication
-
If look in the directory, there are two files. Program.cs, which is our C# code file and project.json, which is our project file. The project file contains the dependencies of our project. Actually there is another hidden file .gitignore. It lists the files to ignore when uploading project to Github. Lets not worry about that now.
-
Lets first get our dependencies out our way. Run the following command at the terminal. This will download any required dependencies.
dnu restore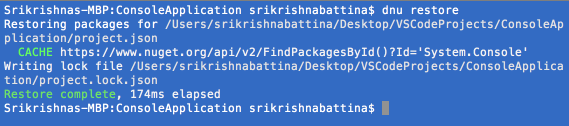
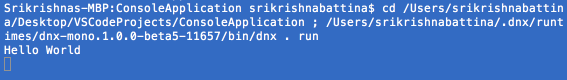
- Now lets run our app with the following command and see the output in all its glory.
dnx . run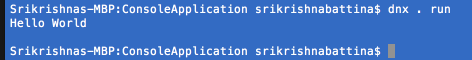
- This is great. Wait! where are the binaries? This is the magic of new compiler “Roslin”. It compiles the code and runs it from memory. This is great but I don’t want to distribute my super secret app in source code. How do I generate the binary? Run the following command from terminal.
dnu build- Oh, what is that? We got a big stacktrace and no binary. As it so happens there is some imcompatibility between dnx and mono in this preview build. So we can’t generate binary using dnx now.
    Srikrishnas-MBP:ConsoleApplication srikrishnabattina$ dnu build

    Building ConsoleApplication for DNX,Version=v4.5.1
     Using Project dependency ConsoleApplication 1.0.0
         Source: /Users/srikrishnabattina/Desktop/VSCodeProjects/ConsoleApplication/project.json

     Using Assembly dependency framework/mscorlib 4.0.0.0
         Source: /usr/local/Cellar/mono/4.0.1/lib/mono/4.5/mscorlib.dll

     Using Assembly dependency framework/System 4.0.0.0
         Source: /usr/local/Cellar/mono/4.0.1/lib/mono/4.5/System.dll

     Using Assembly dependency framework/System.Core 4.0.0.0
         Source: /usr/local/Cellar/mono/4.0.1/lib/mono/4.5/System.Core.dll

     Using Assembly dependency framework/Microsoft.CSharp 4.0.0.0
         Source: /usr/local/Cellar/mono/4.0.1/lib/mono/4.5/Microsoft.CSharp.dll

    System.IO.EndOfStreamException: Failed to read past end of stream.
      at System.IO.BinaryReader.ReadChar () [0x00000] in <filename unknown>:0
      at Microsoft.CodeAnalysis.CvtResFile.ReadStringOrID (System.IO.BinaryReader fhIn) [0x00000] in <filename unknown>:0
      at Microsoft.CodeAnalysis.CvtResFile.ReadResFile (System.IO.Stream stream) [0x00000] in <filename unknown>:0
      at Microsoft.CodeAnalysis.Compilation.MakeWin32ResourceList (System.IO.Stream win32Resources, Microsoft.CodeAnalysis.DiagnosticBag diagnostics) [0x00000] in <filename unknown>:0
      at Microsoft.CodeAnalysis.CSharp.CSharpCompilation.SetupWin32Resources (Microsoft.CodeAnalysis.CSharp.Emit.PEModuleBuilder moduleBeingBuilt, System.IO.Stream win32Resources, Microsoft.CodeAnalysis.DiagnosticBag diagnostics) [0x00000] in <filename unknown>:0
      at Microsoft.CodeAnalysis.CSharp.CSharpCompilation.CompileImpl (Microsoft.CodeAnalysis.Emit.CommonPEModuleBuilder moduleBuilder, System.IO.Stream win32Resources, System.IO.Stream xmlDocStream, Boolean generateDebugInfo, Microsoft.CodeAnalysis.DiagnosticBag diagnostics, System.Predicate`1 filterOpt, CancellationToken cancellationToken) [0x00000] in <filename unknown>:0
      at Microsoft.CodeAnalysis.Compilation.Compile (Microsoft.CodeAnalysis.Emit.CommonPEModuleBuilder moduleBuilder, System.IO.Stream win32Resources, System.IO.Stream xmlDocStream, Boolean generateDebugInfo, Microsoft.CodeAnalysis.DiagnosticBag diagnostics, System.Predicate`1 filterOpt, CancellationToken cancellationToken) [0x00000] in <filename unknown>:0
      at Microsoft.CodeAnalysis.Compilation.Emit (Microsoft.CodeAnalysis.EmitStreamProvider peStreamProvider, Microsoft.CodeAnalysis.EmitStreamProvider pdbStreamProvider, Microsoft.CodeAnalysis.EmitStreamProvider xmlDocumentationStreamProvider, Microsoft.CodeAnalysis.EmitStreamProvider win32ResourcesStreamProvider, IEnumerable`1 manifestResources, Microsoft.CodeAnalysis.Emit.EmitOptions options, Microsoft.CodeAnalysis.CodeGen.CompilationTestData testData, System.Func`1 getHostDiagnostics, CancellationToken cancellationToken) [0x00000] in <filename unknown>:0
      at Microsoft.CodeAnalysis.Compilation.Emit (System.IO.Stream peStream, System.IO.Stream pdbStream, System.IO.Stream xmlDocumentationStream, System.IO.Stream win32Resources, IEnumerable`1 manifestResources, Microsoft.CodeAnalysis.Emit.EmitOptions options, Microsoft.CodeAnalysis.CodeGen.CompilationTestData testData, System.Func`1 getHostDiagnostics, CancellationToken cancellationToken) [0x00000] in <filename unknown>:0
      at Microsoft.CodeAnalysis.Compilation.Emit (System.IO.Stream peStream, System.IO.Stream pdbStream, System.IO.Stream xmlDocumentationStream, System.IO.Stream win32Resources, IEnumerable`1 manifestResources, Microsoft.CodeAnalysis.Emit.EmitOptions options, CancellationToken cancellationToken) [0x00000] in <filename unknown>:0
      at Microsoft.Framework.Runtime.Roslyn.RoslynProjectReference.EmitAssembly (System.String outputPath) [0x00000] in <filename unknown>:0
      at Microsoft.Framework.PackageManager.ProjectBuilder.Build (System.String name, System.String outputPath) [0x00000] in <filename unknown>:0
      at Microsoft.Framework.PackageManager.BuildContext.Build (System.Collections.Generic.List`1 diagnostics) [0x00000] in <filename unknown>:0
      at Microsoft.Framework.PackageManager.BuildManager.Build () [0x00000] in <filename unknown>:0
      at Microsoft.Framework.PackageManager.Program+<>c__DisplayClass3_4.<Main>b__8 () [0x00000] in <filename unknown>:0
      at Microsoft.Framework.Runtime.Common.CommandLine.CommandLineApplication.Execute (System.String[] args) [0x00000] in <filename unknown>:0
      at Microsoft.Framework.PackageManager.Program.Main (System.String[] args) [0x00000] in <filename unknown>:0
      at (wrapper managed-to-native) System.Reflection.MonoMethod:InternalInvoke (System.Reflection.MonoMethod,object,object[],System.Exception&)
      at System.Reflection.MonoMethod.Invoke (System.Object obj, BindingFlags invokeAttr, System.Reflection.Binder binder, System.Object[] parameters, System.Globalization.CultureInfo culture) [0x00000] in <filename unknown>:0
    --- End of stack trace from previous location where exception was thrown ---
      at System.Runtime.ExceptionServices.ExceptionDispatchInfo.Throw () [0x00000] in <filename unknown>:0
      at Microsoft.Framework.Runtime.Common.EntryPointExecutor.Execute (System.Reflection.Assembly assembly, System.String[] args, IServiceProvider serviceProvider) [0x00000] in <filename unknown>:0
at dnx.host.Bootstrapper.RunAsync (System.Collections.Generic.List`1 args) [0x00000] in <filename unknown>:0 -
For now lets just run the code directly and ship our binary when the tooling is ready, but I don’t like editing code in a text editor and go back to terminal to run the code.
-
If you followed the directions and set up your environment properly, we can open our project in VSCode by running the following command.
code .- Our project is opened in VSCode. Intellisense works out of box.
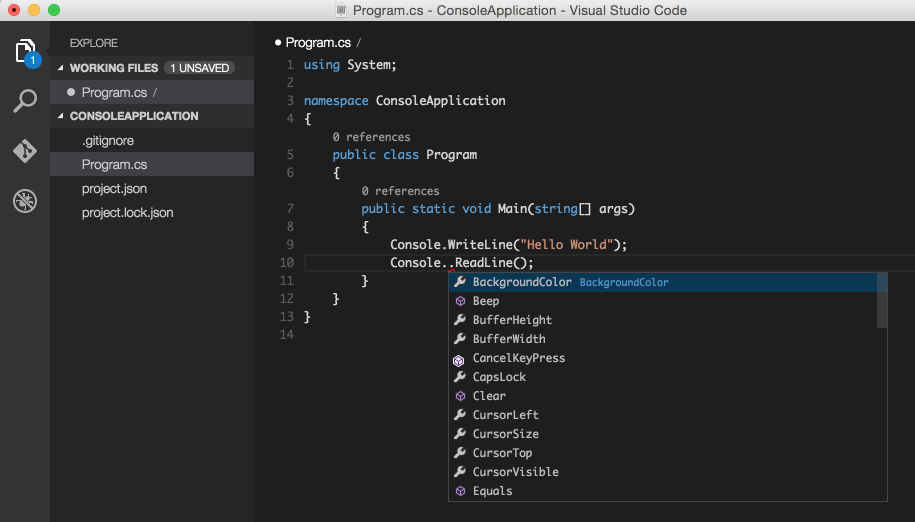
-
Lets run the program. Hmm, there is no menu or toolbar to “Run”. Since VSCode is a code editor, not an IDE, we have to interact with it using the command palette.
-
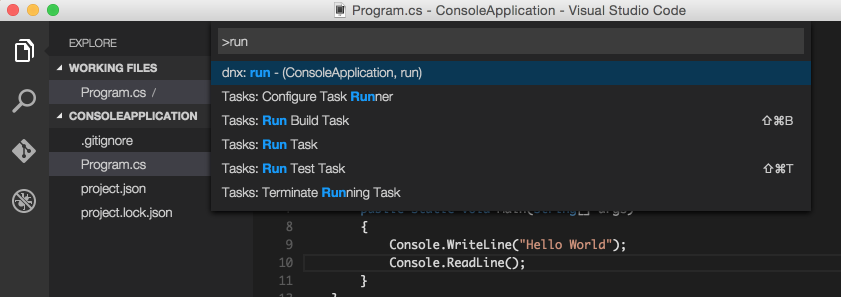
Open the command palette (CMD + P), and type “run”. The command palette shows a list of filtered results. The first entry is “dnx: run - (ConsoleApplication, run)”. Go ahead and press enter.
- VSCode runs your code and sends output to the terminal. After printing “Hello World”, the program is waiting for us to press the enter/return key (remember there is a “Console.ReadLine()” statement). Press enter/return key to continue.
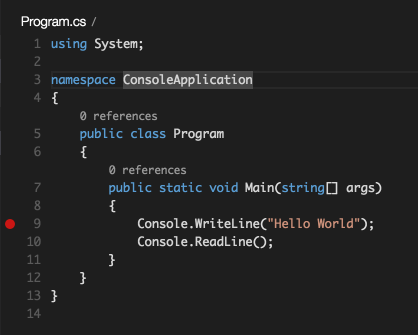
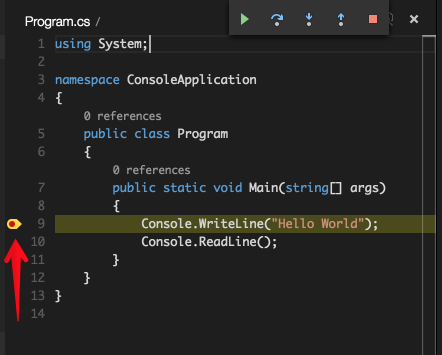
- Ok, now we can run the program but how do we debug it? First lets setup a break-point in our program, by clicking in the gutter at line 9.
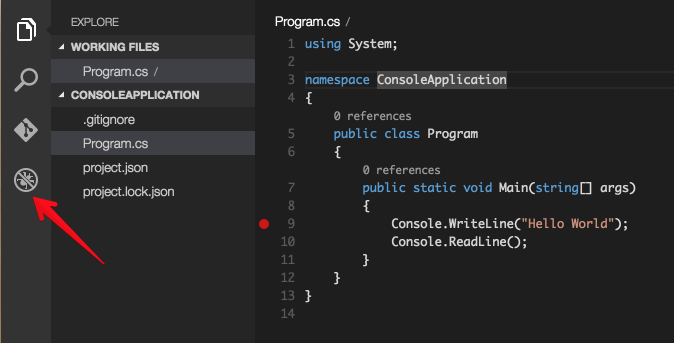
- Now click on the debug icon in the Viewbar
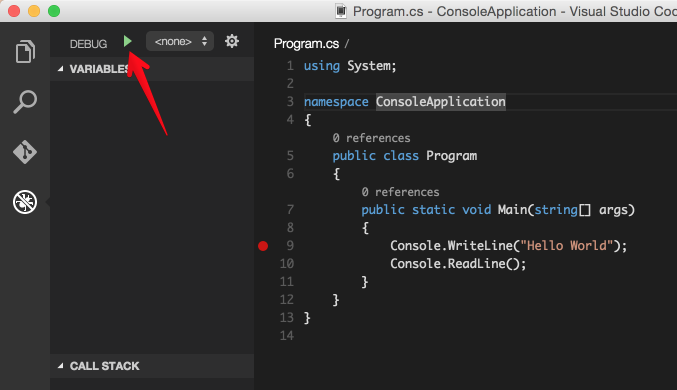
- Go ahead and press the “Play” button on the debug bar.
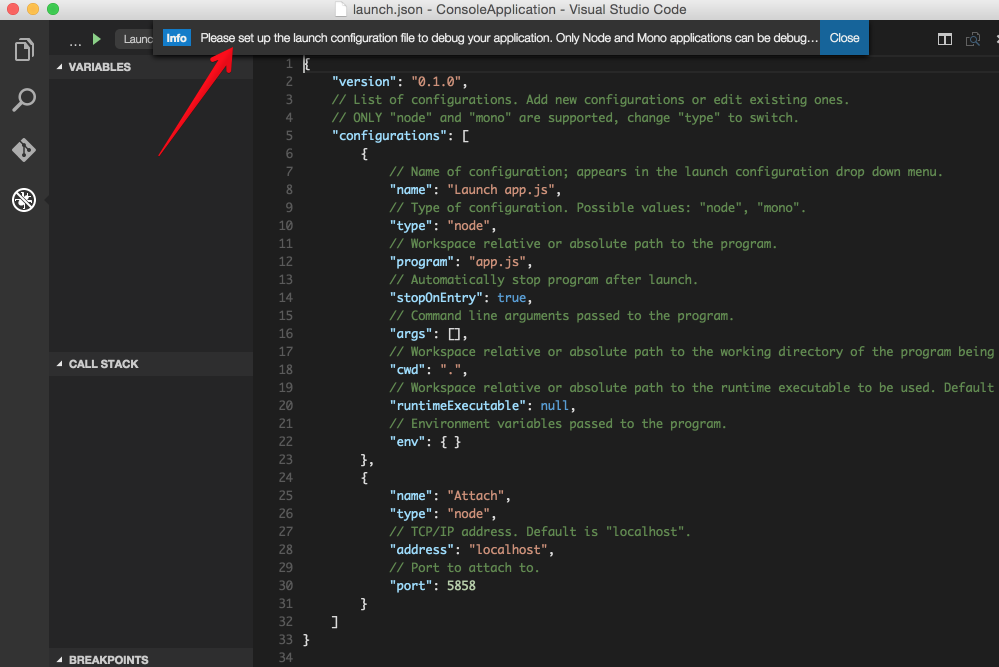
- VSCode popped-up a message saying we need to create a launch configuration. It also created a sample configuration file “launch.json” in our project folder.
- By default, VSCode created a launch configuration for Node.js application. Lets modify it for our program. Change the “name” to “Debug ConsoleApplication”, “type” to “mono” and “program” to “ConsoleApplication.exe”.
{
    "version": "0.1.0",
    // List of configurations. Add new configurations or edit existing ones.
    // ONLY "node" and "mono" are supported, change "type" to switch.
    "configurations": [
        {
            // Name of configuration; appears in the launch configuration drop down menu.
            "name": "Debug ConsoleApplication",
            // Type of configuration. Possible values: "node", "mono".
            "type": "mono",
            // Workspace relative or absolute path to the program.
            "program": "ConsoleApplication.exe",
            // Automatically stop program after launch.
            "stopOnEntry": true,
            // Command line arguments passed to the program.
            "args": [],
            // Workspace relative or absolute path to the working directory of the program being debugged. Default is the current workspace.
            "cwd": ".",
            // Workspace relative or absolute path to the runtime executable to be used. Default is the runtime executable on the PATH.
            "runtimeExecutable": null,
            // Environment variables passed to the program.
            "env": { }
        },
        {
            "name": "Attach",
            "type": "mono",
            // TCP/IP address. Default is "localhost".
            "address": "localhost",
            // Port to attach to.
            "port": 5858
        }
    ]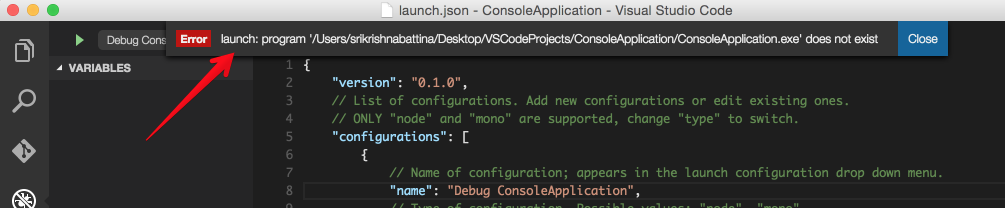
}- Lets try again. Press the “Play” button. Hmm, another popup saying “ConsoleApplication.exe does not exist”.
-
We need a binary to debug, but we couldn’t generate the binary (remember the big stacktrace when trying to build).
-
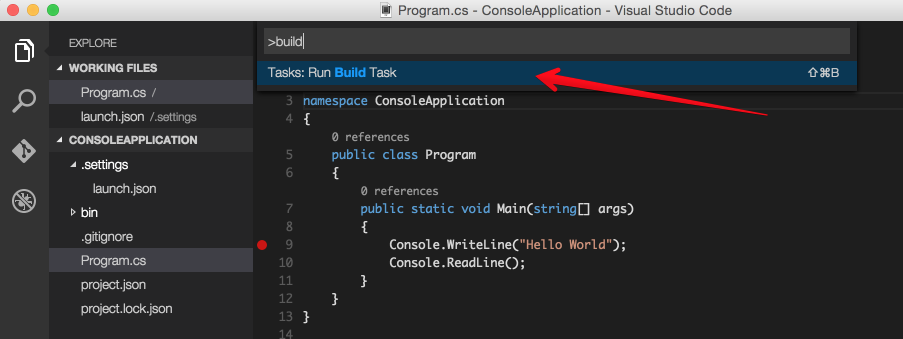
Lets see if VSCode can help us in generating the binary. Goto command palette (CMD + P) and type “build”. Great, we see a build task. Press enter/return key.
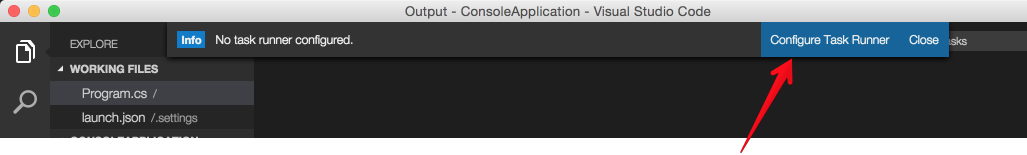
- Great, one more popup. Click on “Configure Task Runner”. VSCode created a new configuration file “tasks.json”.
- Just like previous launch configuration, this is also configured for Typescript task. It has multiple tasks but are commented. We need to modify this for C#. If you scroll down, you will see a task for “MSBuild”. Lets comment out Typescript task and un-comment MSBuild task.
{
    "version": "0.1.0",
    "command": "msbuild",
    "args": [
        // Ask msbuild to generate full paths for file names.
        "/property:GenerateFullPaths=true"
    ],
    "taskSelector": "/t:",
    "showOutput": "silent",
    "tasks": [
        {
            "taskName": "build",
            // Show the output window only if unrecognized errors occur.
            "showOutput": "silent",
            // Use the standard MS compiler pattern to detect errors, warnings
            // and infos in the output.
            "problemMatcher": "$msCompile"
        }
    ]
}-
Lets try again to build. Either go to command palette and type “build” and press return/enter key or use the shortcut Shift+Cmd+B.
-
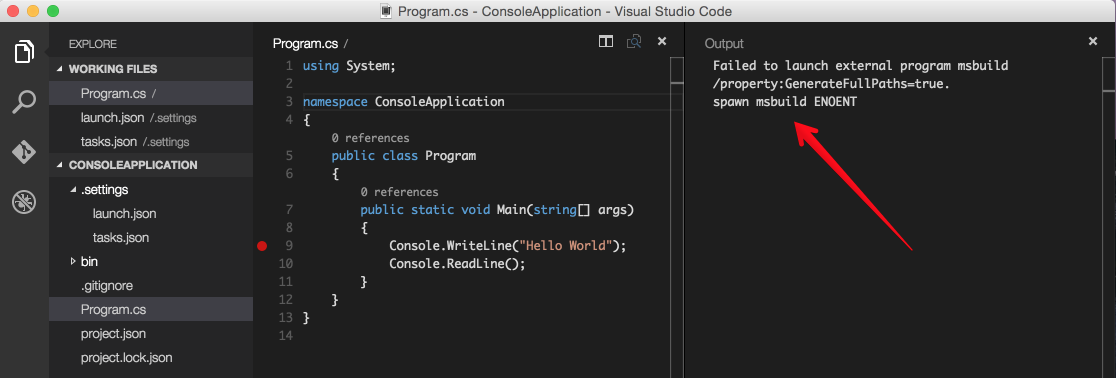
This didn’t work either. The output window displayed “Failed to launch external program msbuild”
- Since we are on Mac OSX, lets try mono’s xbuild. Change the “command” in “tasks.json” from “msbuild” to “xbuild”.
{
    "version": "0.1.0",
    "command": "xbuild",
    "args": [
        // Ask msbuild to generate full paths for file names.
        "/property:GenerateFullPaths=true"
    ],
    "taskSelector": "/t:",
    "showOutput": "silent",
    "tasks": [
        {
            "taskName": "build",
            // Show the output window only if unrecognized errors occur.
            "showOutput": "silent",
            // Use the standard MS compiler pattern to detect errors, warnings
            // and infos in the output.
            "problemMatcher": "$msCompile"
        }
    ]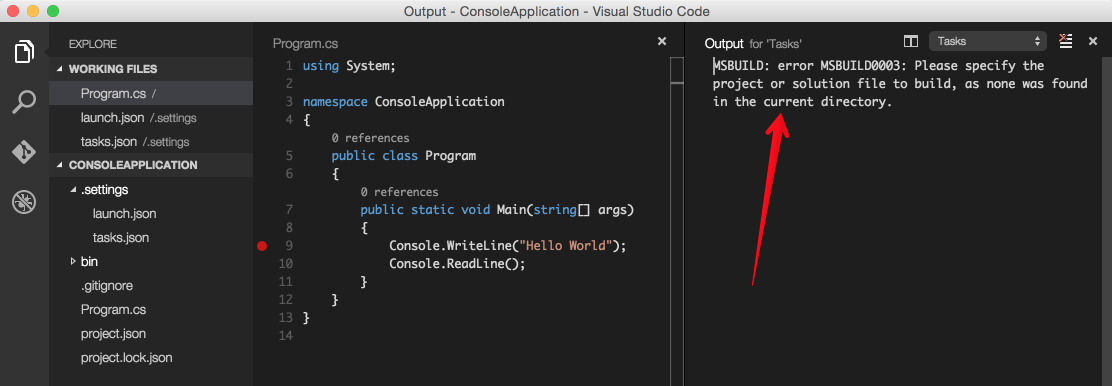
}- Now we got another error saying “MSBUILD: error MSBUILD0003: Please specify the project or solution file to build, as none was found in the current directory.”
- This is understandable as xbuild doesn’t understand “project.json”. We need good old csproj file. Lets create a new file called “ConsoleApplication.csproj”.
<Project DefaultTargets = "Build"
    xmlns="http://schemas.microsoft.com/developer/msbuild/2003">

    <!-- Specify the inputs by type and file name -->
    <ItemGroup>
        <CSFile Include = "Program.cs"/>
    </ItemGroup>

    <Target Name = "Build">
        <!-- Run the Visual C# compilation using input files of type CSFile -->
        <CSC  Sources = "@(CSFile)"
            DebugType="full"
            Optimize="no"
            OutputAssembly="ConsoleApplication.exe" >

            <!-- Set the OutputAssembly attribute of the CSC task to the name of the executable file that is created -->
            <Output TaskParameter="OutputAssembly"
                ItemName = "EXEFile" />
        </CSC>
    </Target>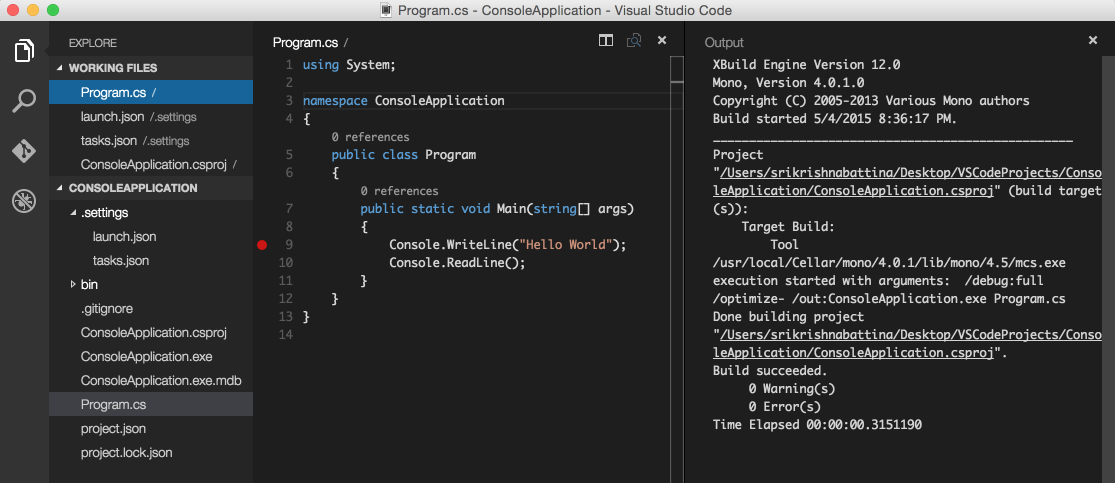
</Project>- Lets give one more try. Run build command, command palette - build or Shift+Cmd+B. Success. The output wondows shows that build was successful.
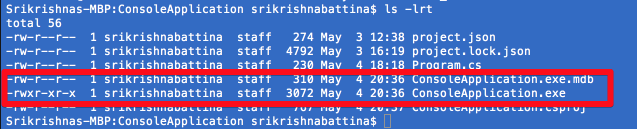
- If you check the project folder, you see two new files “ConsoleApplication.exe” and “ConsoleApplication.exe.mdb”.
- Now our binaries are ready, lets try to debug again. Click on the “Debug” icon in the Viewbar and then click “Play” button in the debug bar.
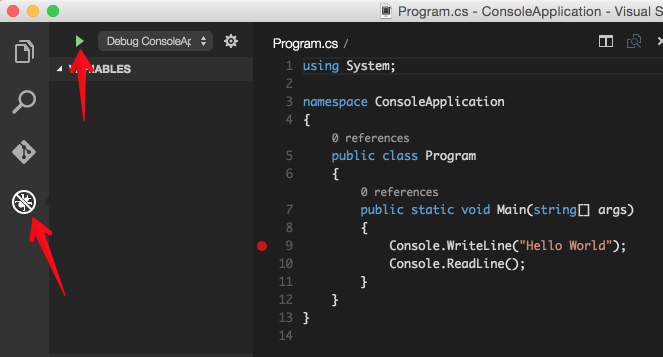
- Look at that! Our program started in debug mode and stopped at the break-point.

- Now you can debug your code to your heart’s content. Step-in, step-over, step-out, continue or stop.
Thanks for entertaining my ramble. Hope this has been a productive experience.